Liquid filling lines are becoming faster, smarter, and less forgiving. In 2026, leading systems will combine servo-driven fillers, automatic changeovers, vision inspection, and connected maintenance tools. Yet advanced equipment alone will not eliminate production delays. A poorly adjusted capper can still stop a line within minutes.
The OEE Foundation identifies 85% OEE as a world-class benchmark, while many plants operate well below that level. Availability remains a major weakness, especially when cleaning, format changes, minor stops, and material shortages are recorded inaccurately. PMMI’s packaging automation reports also highlight stronger automation adoption, driven by labor shortages, higher product variety, and pressure for consistent output. These trends make practical downtime control more important than purchasing the newest machine.
This guide examines How to reduce downtime of liquid filling production lines through measurable, line-level actions. It considers filler calibration, pump wear, nozzle dripping, conveyor accumulation, and changeover discipline. A ten-minute pause may look harmless, but repeated stops can remove hours from a weekly schedule. Small losses matter.
Experienced engineers often begin with a downtime map, not a replacement project. They record the exact stop time, product, station, operator action, and recovery method. That evidence supports targeted improvements and reduces guesswork. However, not every digital dashboard delivers useful insight. Some plants collect data without correcting its definitions. That is an uncomfortable weakness.
Reliable performance requires both technology and operating discipline. The following sections compare top liquid filling line features, maintenance practices, and realistic improvement methods for 2026. Targets should be verified against product viscosity, container design, hygiene requirements, and actual production records. Each line behaves differently.
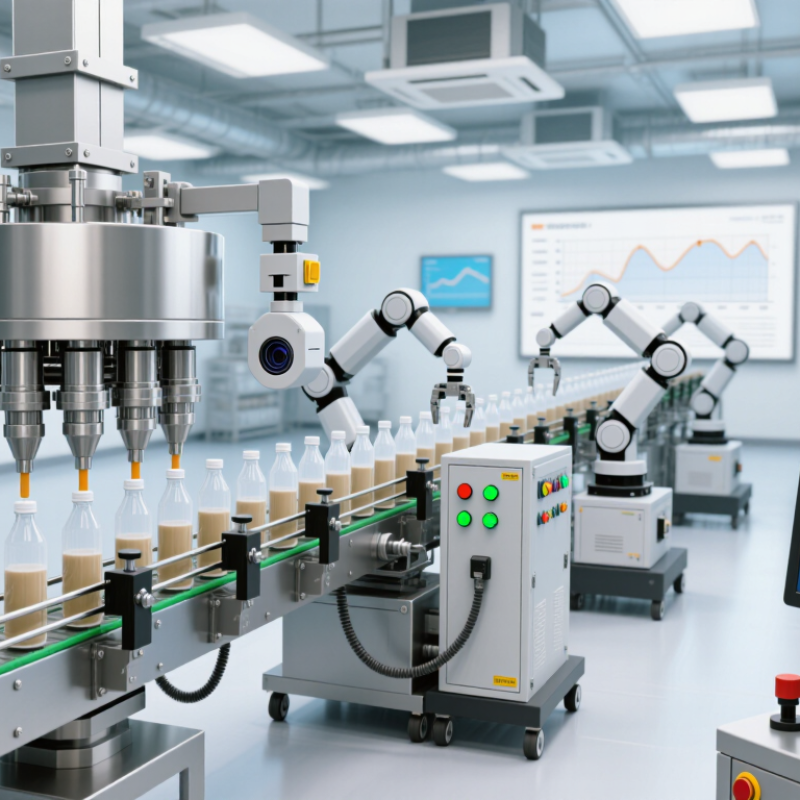
2026 Liquid Filling Lines: Target 85% OEE to Control Downtime
An 85% OEE target gives liquid-filling teams a practical reference, not a guaranteed result. The widely cited benchmark from OEE.com’s industry guidance describes 85% as world-class performance for discrete manufacturing. It is not a liquid-filling-line guarantee. Product viscosity, container changes, sanitation, and staffing all affect results.
Track availability, performance, and quality separately. A filler may run quickly yet lose hours to changeovers or rejected caps. Record each stop at the machine, with its duration and cause. Keep categories specific: a dripping nozzle is different from a blocked conveyor. Small details matter. Review the records by shift, SKU, and line speed; otherwise, a weekly average can hide a recurring ten-minute stoppage.
Use the baseline to set a realistic improvement path toward 85%. SMRP’s Best Practices and Metrics guidance emphasizes consistent definitions for maintenance measures, helping teams compare results without changing the rules midstream. Check sensors, inspect seals, and verify fill accuracy during planned windows. Then compare downtime before and after each change. One caution: teams can improve the number by excluding difficult stops, but that does not improve production. Be honest about what counts.
Practical downtime-control measures and example operating targets for liquid filling lines
| Area | Downtime or OEE measure | Example 2026 target | Practical action |
|---|---|---|---|
| Overall equipment effectiveness | OEE | 85% | Track availability, performance, and quality separately; prioritize the largest loss rather than treating OEE as a single cause. |
| Availability | Run time ÷ planned production time | 90% | Log every stop with a consistent reason code and review the top recurring causes at shift handover. |
| Performance | Actual output ÷ theoretical output during run time | 95% | Check whether slow cycles and brief stoppages are caused by starwheel timing, container infeed, cap supply, or downstream accumulation. |
| Quality | Good units ÷ total units produced | 99.4% | Trend rejects by defect type, including fill-volume errors, cap defects, leaks, and damaged containers; verify inspection checks. |
| Changeover | Time from last good unit of one run to first good unit of the next | Establish a site baseline; reduce it by 15% as a local improvement goal | Prepare parts and tools before the stop, use a standard changeover checklist, and separate external tasks from work that requires the line to be stopped. |
| Unplanned stoppages | Stops by cause, frequency, and total minutes | Reduce the three largest recurring causes month over month | Use a short cause-and-countermeasure review; confirm each action has an owner and a completion date. |
| Preventive maintenance | Planned maintenance tasks completed on schedule | At least 95% completion as a site planning goal | Schedule inspections around critical components such as seals, pumps, valves, sensors, conveyors, and cap-handling equipment. |
| Operator response | Time to acknowledge and record a line stop | Record stop events during the shift; set a response goal based on site needs | Train operators on safe first checks and escalation rules; do not bypass guards or safety interlocks to recover production. |
Note: The 85% OEE objective is a commonly used benchmark, not a guarantee or universal standard. The supporting figures and improvement goals above are illustrative planning targets, not measured results for a specific facility. OEE = availability × performance × quality; 90% × 95% × 99.4% is approximately 85%.
Common causes include empty tanks, blocked nozzles, container jams, slow changeovers, mechanical wear, and control faults. Small stops matter.
Record the exact minute, product, operator action, and affected station. Compare these details across every shift. Look for patterns.
A dry supply line may cause pressure drops. Blocked nozzles can create uneven fills, foam, or repeated underfilled containers.
Photograph the jam before adjusting guides. Check alignment, container spacing, and sensor feedback. A small guide error can stop bottles repeatedly.
Waiting for hoses, seals, tools, or drainage can extend a planned task. A twenty-minute rinse may become an hour.
Prepare hoses, gaskets, tools, and approved cleaning solutions before production ends. Assign separate people to disassembly, cleaning preparation, and records.
Record rinse conductivity, return temperature, pressure, and cycle duration. These readings provide evidence. They do not replace inspection or validation.
Yes, when the equipment design allows it. One person can prepare cleaning materials while another handles disassembly. Safety and hygiene controls still matter.
Inspect seals, nozzles, sensors, and moving parts regularly. Worn seals may leak before alarms appear. Maintenance planning is helpful, but never perfect.
Keep a board beside the filler with categories for supply, cleaning, containers, mechanics, controls, and staffing. Review three recent changeovers, not one ideal example.
In 2026, reducing downtime on liquid filling lines starts with setting a practical OEE target of 85% and identifying where production time is lost. Teams should map the six main sources of downtime across filling operations, such as unplanned equipment stops, slow changeovers, material interruptions, and process adjustments. This makes it easier to distinguish recurring problems from isolated incidents and focus maintenance efforts where they can have the greatest impact.
How to reduce downtime of liquid filling production lines also depends on disciplined planning and reliable data. A structured 30–60-minute CIP plan can help shorten changeover losses, while MTBF, MTTR, and Pareto analysis can reveal which failures deserve priority. Before increasing production scale, validate sensors and PLC functions, and confirm that applicable 21 CFR Part 211 controls are properly implemented. Together, these steps support more predictable operation, faster recovery, and sustained line reliability.

 Yongli Machine